
01 Short answer: what Core Web Vitals are
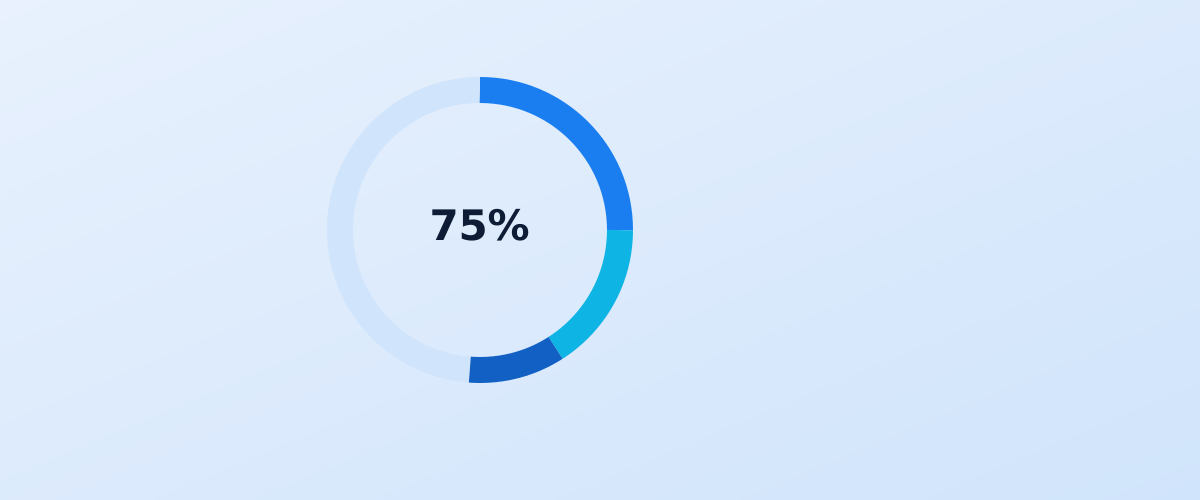
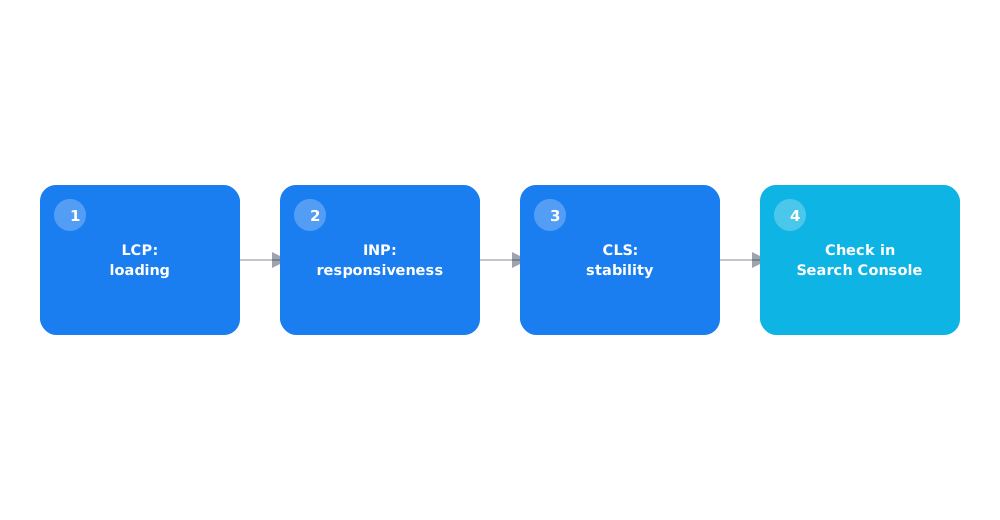
Core Web Vitals are three metrics Google uses to measure how fast and stable a page feels to a real visitor: how quickly the main content loads (LCP), how responsive the page is to user input (INP), and how visually stable the layout stays (CLS). A page only earns a "good" rating if all three metrics pass at the 75th percentile of real visits over the last 28 days — passing on two out of three doesn't count.
Below, each metric is broken down on its own: what it measures, the 2026 thresholds, how to check it, and what actually moves the needle.
02 LCP: how to speed up loading the main content
Largest Contentful Paint (LCP) measures the time until the largest visible element on screen finishes rendering — usually a hero image, a video, or a block of text near the top of the page. A result under 2.5 seconds is considered good; anything slower than 4 seconds is rated poor, per the official metric description on web.dev.
LCP usually suffers from the same handful of causes, and that's where a check should start.
- a heavy hero image or video with no compression and no modern format (WebP, AVIF);
- a slow server response — time to first byte (TTFB) eats up seconds before rendering even begins;
- render-blocking CSS and JS files the browser has to load and process before showing any content;
- no preload hint for critical above-the-fold resources.
A practical fix almost always starts with compressing and reformatting the hero image, pushing non-critical JavaScript later in the load order, and using a CDN if the server sits far from the site's audience.
03 INP: how to improve responsiveness
Interaction to Next Paint (INP) replaced the older First Input Delay metric and measures how long it takes between a user action — a click, tap, or key press — and a visible response on screen, across the entire visit rather than just the first interaction. A result under 200 milliseconds is considered good, per the metric description on web.dev.
INP usually drops where the browser's main thread is busy with heavy computation right at the moment of a click — and that points to specific technical causes.
- large JavaScript event handlers that run synchronously and block the main thread;
- third-party scripts (chat widgets, analytics, ad tags) that grab browser resources at an inconvenient moment;
- excessive UI re-rendering for simple actions, like typing into a form field.
Breaking long JavaScript tasks into smaller chunks and deferring third-party scripts that aren't needed right when the page opens usually gives the fastest improvement to INP.
04 CLS: how to stop elements from jumping around
Cumulative Layout Shift (CLS) measures how much page elements move after the user has already started viewing them — the classic example is text that jumps down when an image or ad slot suddenly loads above it. A score under 0.1 is considered good, per the metric description on web.dev.
Unlike LCP and INP, CLS is almost always fixed with the same handful of layout-level techniques.
- set width and height attributes on every image and video so the browser reserves space in advance;
- reserve a fixed height for ad slots and widgets before they've actually loaded;
- avoid inserting new content above content the user is already looking at, without a deliberate user action;
- use `font-display: optional` or font preloading to avoid a text shift when the real font swaps in.
CLS is usually the fastest metric to fix technically, but it's also the easiest to break again — for example, by adding a cookie-consent banner with no space reserved for it.
05 How to check your own site's scores
Before fixing anything, it helps to understand the difference between two types of performance data — they don't always agree.
- Field data — real measurements from actual site visitors over 28 days, from the Chrome UX Report. This is what Google uses for ranking, and what you should rely on.
- Lab data — a one-off measurement under controlled conditions, for example from Lighthouse. Useful for debugging a specific issue, but doesn't reflect the real experience of every visitor.
The Core Web Vitals report in Google Search Console shows field data for your actual URLs, grouped by issue, and is the most direct way to see what visitors actually experience. PageSpeed Insights combines both data types on one page and points to the specific technical cause behind each metric.
06 The 2026 thresholds
It helps to keep a quick-reference table of the current good/needs-improvement/poor cutoffs for each metric.
| Metric | Good | Needs improvement | Poor |
|---|---|---|---|
| LCP (loading) | under 2.5s | 2.5–4s | over 4s |
| INP (responsiveness) | under 200ms | 200–500ms | over 500ms |
| CLS (stability) | under 0.1 | 0.1–0.25 | over 0.25 |
One important detail: a page only passes overall if all three metrics land in the "good" range at the same time for 75% of visits. A good score on two out of three metrics still counts as an overall fail.
07 How Core Web Vitals affects rankings and conversion
Core Web Vitals is part of the page experience signals Google factors into ranking — covered in more detail in the official page experience documentation. In practice, it isn't the only or the heaviest-weighted factor: content relevance and completeness almost always matter more. But when content quality is roughly on par with a competitor, Core Web Vitals can be exactly the tiebreaker that decides who ranks higher.
The effect on conversion is often more visible than the effect on rankings: slow loading and jumpy elements directly increase the share of visitors who leave before ever seeing the offer. If a site already has the SEO basics covered but growth has stalled, technical metrics are one of the first things worth checking — a general checklist is in a self-run SEO audit, and common causes of stalled growth are covered in why a website isn't ranking on Google.
08 FAQ
What do LCP, INP, and CLS stand for?
LCP (Largest Contentful Paint) is the time until the largest element on screen finishes rendering. INP (Interaction to Next Paint) is how fast the interface responds to user actions. CLS (Cumulative Layout Shift) measures how much page elements move after the user starts viewing them.
Where can I check my site's Core Web Vitals?
The most accurate source is the Core Web Vitals report in Google Search Console: it shows field data for your real URLs over 28 days. PageSpeed Insights gives similar data plus a lab measurement for debugging a specific page.
What LCP threshold counts as good in 2026?
Under 2.5 seconds is good, 2.5 to 4 seconds needs improvement, and over 4 seconds is poor. The score is measured across 75% of real visits over 28 days, not as a one-off test.
Why did CLS suddenly get worse after a recent site change?
The usual cause is a new element with no reserved space — a cookie banner, an ad slot, or an image missing width and height attributes, causing content to shift after the page has already started rendering.
Is Core Web Vitals a direct ranking factor?
It's one of the page experience signals Google factors into ranking, but not the only or heaviest one — content relevance and quality almost always matter more. When content quality is comparable to a competitor's, technical metrics can become the deciding difference.
Can a page pass Core Web Vitals with two metrics out of three?
No, a page only gets an overall "good" rating if all three metrics pass at the same time for 75% of visits. A good LCP and CLS with a poor INP still counts as an overall fail.