

GA4 shows how many people left a page without converting — it doesn't show why. Heatmaps and session recordings close exactly that gap: they show how far people scroll, where they click looking for a button that isn't there, and at which form field people give up. Here's what each map type is for, how to install them without a developer, and how to turn a finding into a testable hypothesis instead of just an interesting observation.
01 Why heatmaps matter when you already have GA4
GA4 answers "how many" and "where": how many sessions, what share dropped off at a given funnel step, where clicks led. It doesn't answer "why at that exact step" — and without that answer, it's unclear what to actually change on the page.
Heatmaps and session recordings add a visual layer on top of the same underlying behaviour: you can see what a real person did on the page, second by second. Often the real cause of a drop-off isn't the offer or the price at all — it's an interface detail: a button that visually reads as disabled, a form that's too long, or a key block sitting below the point most visitors actually scroll to.
02 Map types: clicks, scroll, and cursor movement
Different map types capture different slices of behaviour, and getting the full picture usually means looking at at least two of them together rather than relying on one.
- Click maps — which elements people click or tap: real buttons and links, but often elements that aren't clickable at all.
- Scroll maps — how far down the page a given share of visitors actually scrolls; this reveals whether a pricing or testimonial block placed low on the page ever gets seen.
- Move maps (cursor tracking) — where attention lingers (on desktop, cursor movement correlates reasonably well with gaze); useful for checking whether a key block gets noticed at all.
03 Hotjar or Clarity: how to choose for a first setup
For most sites the choice comes down to two tools, and the decision usually hinges on budget and traffic volume rather than map quality.
Microsoft Clarity is free with no cap on the number of recorded sessions, and includes click and scroll maps, session recordings, and integration with Google Analytics and Tag Manager. Hotjar offers a broader toolset — including on-site surveys and feedback widgets — but its free tier caps the number of sessions before switching to sampled recording. For a site just starting with behavioural analytics, a sensible first step is Clarity's free tier: it covers the core scenarios with no time-based limit on data volume, and moving to a paid tool later makes sense once surveys or deeper segmentation are actually needed.
04 Installing it without a developer
Both tools install the same way — a short snippet in the site's <head> — and a developer isn't strictly necessary if the site already has Google Tag Manager or GA4 set up.
- Create a project in the chosen tool and get the tracking snippet;
- add it to the site template directly, or as a separate tag through Google Tag Manager;
- confirm data is coming in — this is usually visible in the tool's dashboard within a few minutes;
- Clarity's official setup and installation guide lists ready-made modules for popular platforms, which is even faster than pasting code by hand.
05 How to read session recordings without drowning in data
The most common mistake when starting with session recordings is watching them back-to-back with no goal. It's easy to burn an hour on twenty clips and walk away with nothing useful if you haven't decided in advance what you're actually looking for.
A better approach is watching a specific segment rather than everything at once — for example, only sessions that reached a form but never submitted it, or only mobile visits on one particular page. That kind of filter usually reveals a repeating pattern within 10–15 recordings: users stumbling over the same form field, or consistently missing a button placed under a banner.
06 Five patterns that show up most often
Before digging into your own site, it helps to know what other teams typically find on heatmaps and recordings — it speeds up recognising the same patterns.
- "Rage clicks" — users repeatedly click an element that looks like a button but isn't one.
- Scroll drop-off before a key block — pricing, testimonials, or a form sit below the point most visitors ever reach.
- A single form field causing friction — the cursor keeps returning to the same field, often a sign of unclear labeling or a validation error.
- The main CTA getting ignored — almost no clicks on the primary action button while secondary links get noticeably more.
- Mobile and desktop behaviour diverging — a block that works fine on desktop shifts out of place or gets covered by another element on a small screen.
07 Turning a finding into an A/B test hypothesis
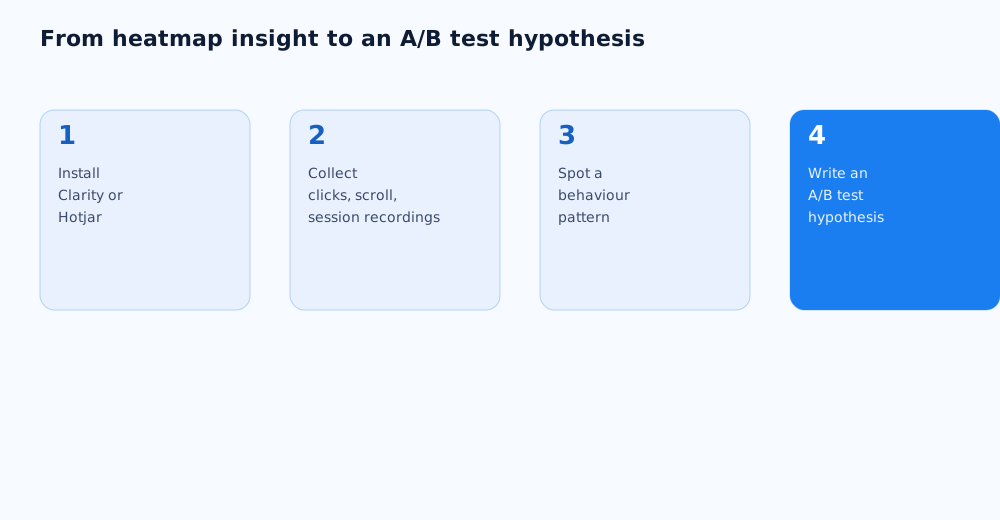
A heatmap observation isn't a decision yet — it's raw material for a hypothesis. A useful hypothesis reads "if we change X, we expect Y, because Z," not just "let's redo the button because it's red."
For example: if a map shows 40% of visitors clicking on a non-functional element that looks like a button, the hypothesis might be — "turning this element into a real, clickable button should increase click-through to the next step, because some users are currently losing intent after a failed click." How to actually run and read that kind of test is covered in our guide to A/B testing for ads — the principles of audience splitting and reading results apply just as well to on-site tests. If there's no time to run these tests and set up the tools in-house, this work can be handed off to a team — see our services page for details.
08 FAQ
Do heatmap tools slow down a website?
Hotjar and Clarity scripts load asynchronously alongside the main content, so there's usually no noticeable impact on page load speed. You can confirm this on your own site by comparing the speed report in GA4 or Search Console before and after installation.
Do I need user consent to record sessions?
Yes — if the site collects personal data or uses analytics cookies, session recording needs to be covered in the privacy policy and, depending on the region, may require consent through a cookie banner. Both tools mask sensitive fields like passwords and card numbers by default.
How many session recordings should I watch before drawing a conclusion?
Usually 10–15 recordings from a single segment is enough to spot a repeating pattern. If behaviour still looks random after that many, the segment is probably defined too broadly.
Can heatmaps replace A/B testing?
No, they're different tools for different stages. A heatmap helps you find what to fix; an A/B test checks whether that fix actually increases conversion rather than just looking like a logical improvement.
Do heatmaps work on mobile devices?
Yes, both tools collect click maps, scroll maps, and session recordings separately for mobile — it's worth reviewing these separately from desktop, since behaviour on a small screen is often different.
Where should I start if the site gets little traffic?
Start with the highest-traffic pages — the homepage, key landing pages, or top-selling product pages — and with Clarity's free tier, which doesn't cap the number of sessions collected over time.