
Google Search Console is a free Google service that shows how the search engine actually sees your site: which queries it shows up for, which pages are indexed and which were skipped, and whether there are technical issues holding back rankings. For a business owner it is not an optional developer tool — it is the only source of data on what Google truly thinks of the site, and it is free, with no agency needed to see it.
01 What Google Search Console is and why a business needs it
Search Console is a dashboard Google provides to site owners for free. Connecting it does not change rankings by itself, but it gives the data needed to tell whether SEO is working and what to focus on first.
The Search Console reports reveal:
- which queries the site shows up for in Google, and how many people actually click through;
- which pages are indexed, and which Google skipped for some reason;
- whether the site has technical issues — from crawl errors to page speed and mobile display problems;
- who links to the site from elsewhere, and from which pages;
- whether the site has received a manual action or a hacking warning.
Search Console is often confused with Google Analytics, but they solve different problems. Search Console shows what happens before the click, inside Google Search; Analytics shows what happens after the click, on the site itself. The article on what ROAS, ACoS, CPL, and CPA mean in plain words is a good next read for ad and sales metrics, but any review of a site's own search performance starts with Search Console data.
02 How to add and verify a site in Search Console
Connecting a site takes only a few minutes, but choosing the right property type matters — it determines what data you will see and how convenient it will be to analyse later.
Search Console offers two property types:
- Domain — combines every version of the site: with and without www, over http and https, and any subdomains. It can only be verified through a DNS record with your domain registrar.
- URL prefix — tied to one specific address, for example only the https version with www. It is verified with an uploaded file, a meta tag on the homepage, or through Google Analytics or Google Tag Manager.
For most sites a Domain property is more convenient: there is no need to add and verify the www and non-www versions separately, since all the data is collected in one place from the start. The one limitation is that it can only be verified through DNS, so you need access to the domain's management panel. If that access is not available, a URL-prefix property verified with a file or meta tag works just as well — it is done directly in the site's code, with no need to contact the registrar.
| Verification method | What you need | Best for |
|---|---|---|
| DNS record | Access to domain settings at the registrar | Domain property; the most reliable method, survives a hosting move |
| HTML file | Hosting access to upload a file to the site's root | A quick one-off check when DNS access is not available |
| Meta tag | Access to the page's head code | Site builders and CMS platforms where adding a tag is easier than uploading a file |
| Google Analytics / Tag Manager | An existing tracking snippet installed on every page | When analytics is already set up and the code is live on the site |
Once a method is chosen, Google checks for the file, record, or tag and grants access within a few minutes. The exact steps for each method are covered in Search Console's help article on verifying site ownership.
03 Sitemap submission and the first indexing check
Right after verifying a site, it is worth submitting a sitemap.xml file — a map of the pages that need to be crawled. This is done in the Sitemaps section: enter the file's address and click Submit.
It is worth understanding that submitting a sitemap does not guarantee indexing; it only speeds up discovery and helps Google prioritise crawling. The requirements for the file itself and how to submit it are covered in Google's documentation on sitemaps.
To check what is happening with a specific page right now, use the URL Inspection tool — the search bar at the top of Search Console. It shows two versions: how the page looks in Google's current index, and how it looks under a live test run at that moment. If a page is not indexed yet but is ready, the same tool lets you request indexing manually — that does not guarantee rankings, but it speeds up the first crawl of a new or updated page.
04 The Performance report: clicks, impressions, CTR, and position
The Performance report is the most-used section of Search Console for a business owner, because it shows exactly how much search traffic the site actually gets, and for which queries.
The report's four metrics mean the following:
- Impressions — how many times a link to the page appeared in Google's results, even if nobody noticed or clicked it;
- Clicks — how many times someone actually followed the link to the site;
- CTR — the ratio of clicks to impressions, showing how compelling the page's title and description are in the results;
- Average position — the site's approximate rank for that query, averaged over the chosen period.
Combining these metrics points to what to do next. If a page has many impressions but a low position, it is likely missing content depth or link authority — check it against the DIY SEO audit checklist to find specific weak points. If the position is already decent, say fifth to tenth place, but the CTR lags behind other pages at a similar position, the title and description are usually the problem — they fail to earn the click even though the page already shows up. The official description of the report's metrics is in Search Console's help article on the Performance report. The report can be filtered by page, query, country, and device, and periods can be compared to track the effect of specific changes made to the site.
05 The Page indexing report: making sense of the statuses
The Pages section shows how many of the site's URLs are indexed and how many are excluded, along with the reason. It is worth not panicking at the sight of an exclusion — several of the reasons are entirely normal and need no action.
The most common reasons pages get excluded from the index include:
- Discovered - currently not indexed — Google knows about the page but has not gotten around to crawling it yet; this is usually fixed by time, internal links from pages that get traffic, and a manual indexing request;
- Crawled - currently not indexed — the page was reviewed but judged not valuable enough for the index; this often points to thin or largely duplicate content;
- Duplicate, Google chose different canonical than user — the page has a near-identical copy, and Google picked which version to treat as the main one; if that choice is wrong, the canonical needs to be set explicitly;
- Page with redirect and Blocked by robots.txt — technically expected statuses for utility or outdated addresses, not an error by themselves.
The rule is simple: only pages that are meant to be in search but are not indexed deserve real concern. The other statuses are part of how a search engine normally works, not a reason to rush and fix something.
06 Core Web Vitals and mobile usability
Two more reports show how comfortable the site is to use on a technical level: loading speed and how correctly it displays on phones. Google factors both into how it evaluates a page alongside its content, though not as heavily as how well the content matches the query.
The Core Web Vitals report is built on real Chrome user data and scores three metrics: the loading speed of the main content (LCP), responsiveness to the first interaction (INP), and visual stability while the page loads (CLS). How these metrics relate to a user's experience of a page is covered in detail in Google's page experience documentation. The Mobile Usability report separately flags specific issues — text that is too small, clickable elements placed too close together, or a missing viewport setting for mobile screens.
Both reports group pages by template rather than by individual URL: if an issue is common to a page type, for example every product card, fixing one template improves every page of that type at once.
07 Links, manual actions, and security issues
The three remaining sections are opened less often, but they are the first to signal a serious problem — from suspicious links to penalties and a hacked site.
Worth checking periodically:
- Links — shows which sites and pages link to yours, along with the most-used anchor text; useful for tracking a backlink profile without paid tools and for spotting a sudden spike of suspicious links early;
- Manual actions — lists penalties applied by Google's specialists for violating the webmaster guidelines; if the section is empty, there is no manual penalty, and a traffic drop is caused by something else;
- Security issues — warns of a hacked site, injected malicious code, or phishing content; these notices call for an immediate response, since Google can demote or remove the site from results entirely until the issue is fixed.
If a site's traffic drops unexpectedly, these two sections are the first place to look, before moving on to the broader diagnosis covered in why your site isn't ranking on Google. If the cause still isn't clear after a self-check, the next step is usually a professional SEO audit and promotion.
If Search Console was just connected to a new or updated site, also go through the SEO checklist for a website launch or redesign — it covers the technical causes of a traffic drop that the Search Console reports end up surfacing.
The Page indexing report is only part of working with Search Console; what to do if a specific page never makes it into the index is covered in detail in how to speed up Google indexing.
08 Frequently asked questions
How long does it take for data to appear in Search Console after verifying a site?
The first indexing data usually shows up within a few hours to a day, and the Performance report starts filling in clicks and impressions within 2–3 days. A representative picture over a full period takes about 2–3 weeks, since Search Console reports data with a 1–2 day delay and keeps history for a maximum of 16 months.
What is the difference between Search Console and Google Analytics?
Search Console shows what happens before the click: which queries the site shows up for in Google, how often, and at what position, plus technical indexing issues. Google Analytics shows what happens after the click: visitor behaviour on the site, conversions, and the path to purchase. They are different tools that complement each other rather than compete.
What should I do if a page shows the status "Discovered - currently not indexed"?
This means Google knows about the page but has not decided to crawl it yet, often because of a limited crawl budget or the page's low perceived importance to the site. Check whether it has internal links from pages that get traffic, add it to the sitemap, and use the URL Inspection tool to request indexing manually.
Can Search Console show that a site has received a manual action?
Yes, there is a dedicated Manual Actions report under Security & Manual Actions. If the report is empty, there is no manual penalty, and a sudden traffic drop is caused by something else — an algorithm change, a technical issue, or lost rankings for specific queries. Checking this report is the first step for any unexplained traffic drop.
Do I need to add both the www and non-www version of my site?
If you use a Domain property, Search Console automatically combines data across all protocols and subdomains, including www and non-www, so there is no need to add them separately. URL-prefix properties have to be added one at a time for each address variant, which is why a Domain property is more convenient for most sites.
How often should I check Search Console?
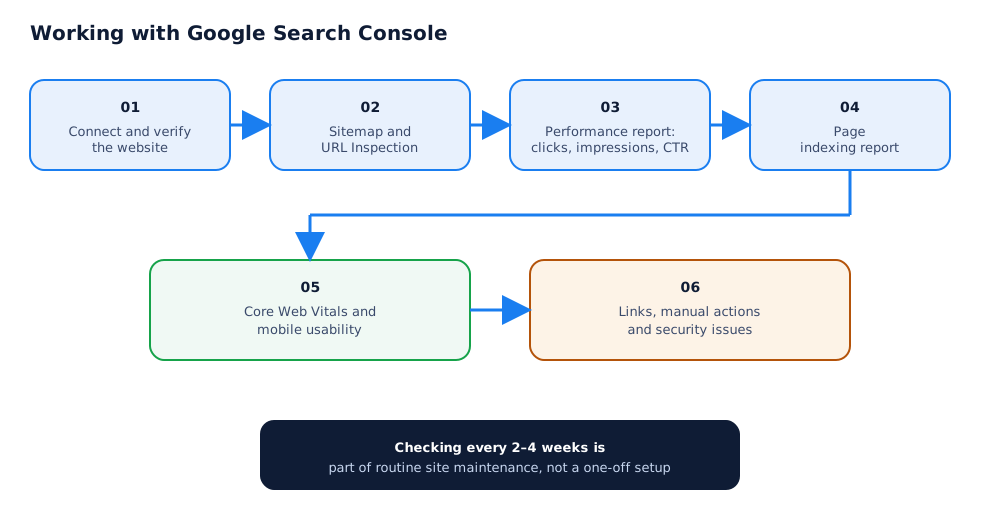
Keep the Security & Manual Actions section and email alerts on at all times — they notify you of critical issues immediately. The Performance and Page indexing reports are enough to review every 2–4 weeks, plus an extra check after publishing new pages or making technical changes to the site.